A New Addition to TC1 Analytics: Human Resources
Notifying Trimble Construction One users of new updates to the Analytics environment.


Trimble Construction One (TC1) Analytics – Trimble’s solution for users to who wish to easily visualize their ERP data without the strain of connecting their software to Power BI or learning its complex tools - has added a new feature. Prior to the recent update, TC1 Analytics provided users with Power BI datasets organized in three categories: Vista Financials, Vista Operations and Team Project Communications. With these measures, users could access standardized reports created by Trimble themselves or create their own reports for key topics like AR and AP aging, cash flow, and open RFIs.
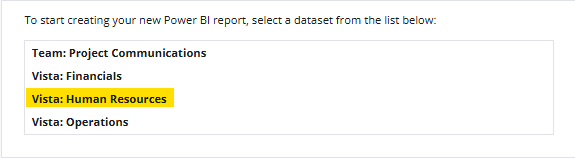
Now, TC1 Analytics has added Vista Human Resources to their lineup, granting users the ability to include HR-related data in their data visualizations. For this week’s Tip-Tuesday, we will examine how to best use this new dataset, as well as explore standard HR reports that Trimble has already installed for its customers in the TC1 environment.
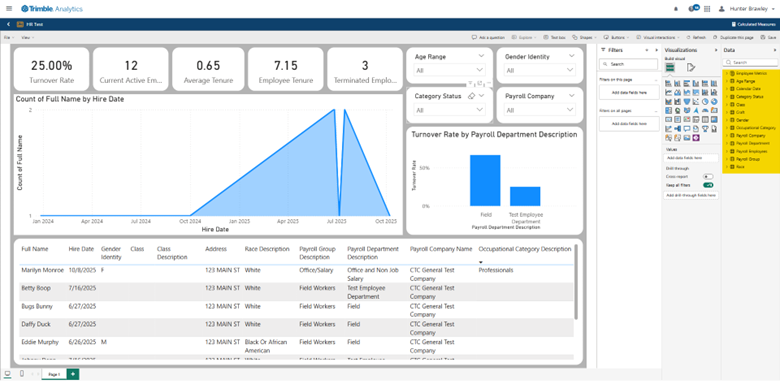
I spent a few minutes in the new environment and generated this basic dashboard. You will notice I have the ability to generate KPI cards indicating totals, filters that allow me to slice through specific categories of data, a bar graph indicating which payroll departments suffer the highest turnover rates, and a matrix providing me with a table of basic information on my internal employees. By no means is this a perfect dashboard, but it illustrates a few basic abilities at your disposal upon selecting the Vista Human Resources environment.
Additionally, users who do not have the time or means to create their own dashboards can utilize a dashboard created by the team at TC1 Analytics. You can find this dashboard in the “Public” folder under “Reports” and the dashboard is titled “Human Resources Summary”.
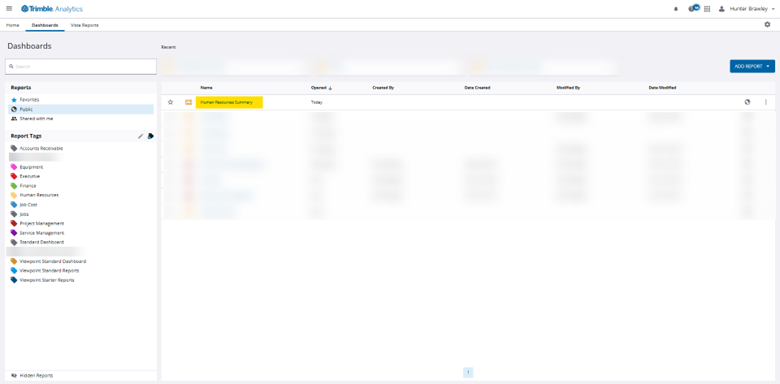
This dashboard provides users with six different pages of data visualizations and an additional seventh page containing several filter slicers for a more customized user experience. You may notice from the screenshot above that the data in these reports is the exact same as my custom report from the earlier example. Whether you access a standard report in TC1 or create your own from scratch, the data will pull from the same resource: your own ERP, either Vista or Spectrum.
This new dataset, as well as the TC1 Analytics environment more broadly, can provide users with a quick and functional means for generating data visualizations for their own internal data. Gone are the days of linking Power BI to a SQL server or other complicated means for achieving this goal. Today, users with the proper licensing need only log into TC1 Analytics to begin building dashboards. If you have any questions regarding Trimble Construction One’s dashboard capabilities or are interested in adding this software to your company's report management repertoire, please visit our website - ConstrucTech Consulting - and Book a Call with one of our consultants.
Trimble Construction One (TC1) Analytics – Trimble’s solution for users to who wish to easily visualize their ERP data without the strain of connecting their software to Power BI or learning its complex tools - has added a new feature. Prior to the recent update, TC1 Analytics provided users with Power BI datasets organized in three categories: Vista Financials, Vista Operations and Team Project Communications. With these measures, users could access standardized reports created by Trimble themselves or create their own reports for key topics like AR and AP aging, cash flow, and open RFIs.
Now, TC1 Analytics has added Vista Human Resources to their lineup, granting users the ability to include HR-related data in their data visualizations. For this week’s Tip-Tuesday, we will examine how to best use this new dataset, as well as explore standard HR reports that Trimble has already installed for its customers in the TC1 environment.
I spent a few minutes in the new environment and generated this basic dashboard. You will notice I have the ability to generate KPI cards indicating totals, filters that allow me to slice through specific categories of data, a bar graph indicating which payroll departments suffer the highest turnover rates, and a matrix providing me with a table of basic information on my internal employees. By no means is this a perfect dashboard, but it illustrates a few basic abilities at your disposal upon selecting the Vista Human Resources environment.
Additionally, users who do not have the time or means to create their own dashboards can utilize a dashboard created by the team at TC1 Analytics. You can find this dashboard in the “Public” folder under “Reports” and the dashboard is titled “Human Resources Summary”.
This dashboard provides users with six different pages of data visualizations and an additional seventh page containing several filter slicers for a more customized user experience. You may notice from the screenshot above that the data in these reports is the exact same as my custom report from the earlier example. Whether you access a standard report in TC1 or create your own from scratch, the data will pull from the same resource: your own ERP, either Vista or Spectrum.
This new dataset, as well as the TC1 Analytics environment more broadly, can provide users with a quick and functional means for generating data visualizations for their own internal data. Gone are the days of linking Power BI to a SQL server or other complicated means for achieving this goal. Today, users with the proper licensing need only log into TC1 Analytics to begin building dashboards. If you have any questions regarding Trimble Construction One’s dashboard capabilities or are interested in adding this software to your company's report management repertoire, please visit our website - ConstrucTech Consulting - and Book a Call with one of our consultants.


Get Started
Take your construction company to the next level. Schedule your initial free consultation and analysis.