Beyond the Surface: Using Power BI Drill-Throughs to Navigate Smartsheet Project Plans
Learn how to integrate Smartsheet with Power BI to create a hierarchical reporting system that uses drill-through functionality to connect high-level project milestones with granular task checklists.

In my last blog post, I outline how users could connect their Smart Sheet and Power BI environments to fully leverage the project management tools of the former and the data visualization tools of the latter. By combining the two solutions, those users can not only maintain effective project management practices but also provide themselves and others with reporting tools to provide a snapshot of a project’s overall health.
Today, we will outline how to not only provide data visualizations for a project plan and checklist, but strategies to connect both sheets in Power BI for seamless integration of hierarchical task tracking.
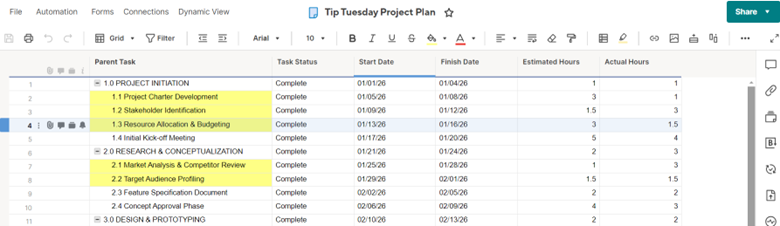
First, we will examine my two base sheets in Smart Sheet. I created a fake project, complete with tasks, due dates and parent tasks (these will be important when we connect the two sheets in Power BI). We can think of the Project Plan as the full scope of milestones we must complete to achieve our project’s goal while the Project Checklist is the detailed tasks necessary to complete those milestones.
I then connect the two sheets to my Power BI environment (see our blog post from 1/27/2026 for details). Once I have connected these two Smart Sheet pages to Power BI, I can construct my two dashboard pages.
Below you will find my Project Plan dashboard. I have a detailed matrix alongside several cards that provide context to my project and filters that allow me to slice through data.
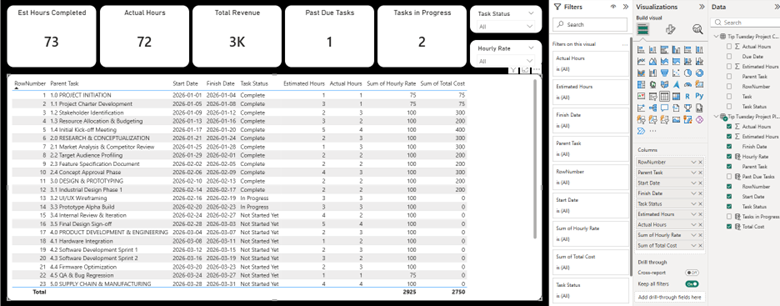
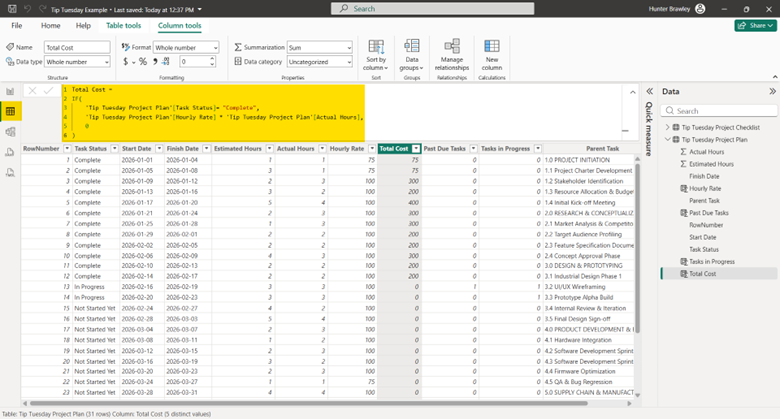
You may notice that some data, like “Total Revenue” or “Past Due Tasks”, were not available to me in my Smart Sheet environment. By utilizing my Table View, I was able to create new columns from scratch like you see below. This feature allows for me to add key data that I may not need to track in Smart Sheet, like hourly rates or revenue.
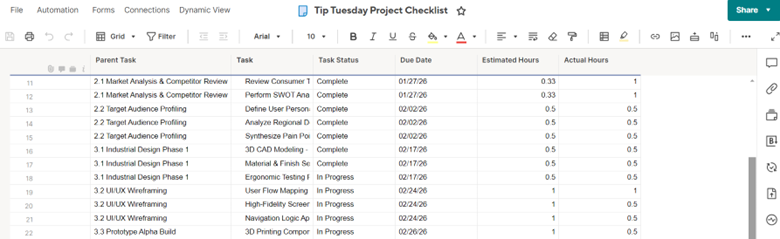
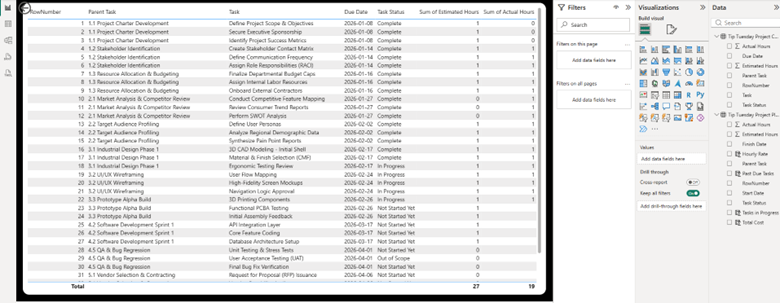
My second sheet, the Project Checklist sheet below, is built similarly but only contains a detailed matrix, no cards or filters. That is because this page is a “Details” page and will act as my destination when I create a “Drill through” and connect the two pages.
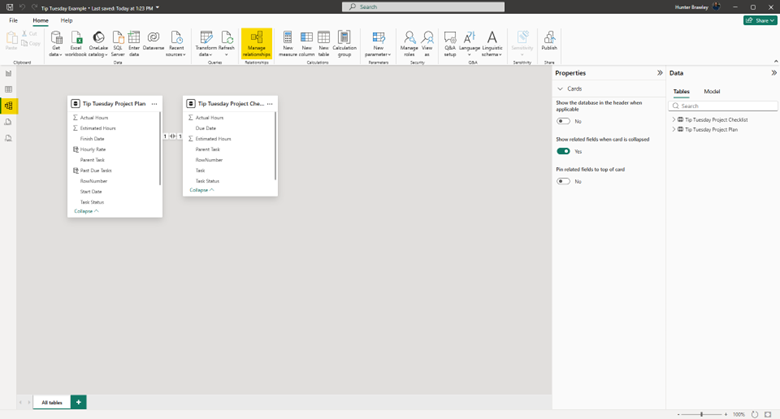
Now that we have established our Project Plan and Project Checklist screens, we are ready to connect the two. I noted earlier that our Parent key would be important. My Project Checklist table has Project Plan task it is directly associated with already in a column. Since that key is there, I can build a relationship between the two similar columns and use it to drill through my data. To do that, I will open the Model view screen and select “Manage relationships” at the top of my screen.
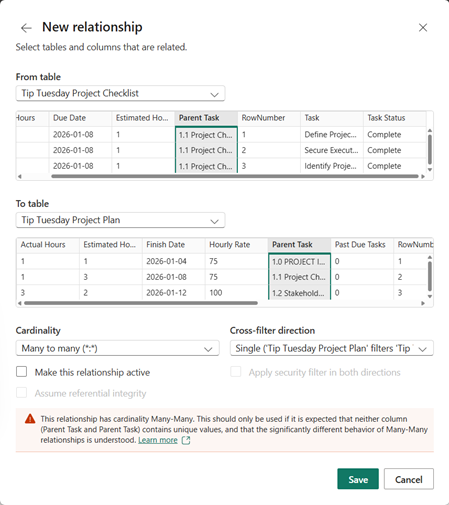
Since my parent column tasks align exactly in the two separate pages, I can make this a many to many relationship without risking any breaks. Once, I have my relationship configured, I can hit “Save.”
With that work complete, I can finish my drill-through. Since my Project Checklist contains the broken-down lists of tasks associated with the Project Plan, I will add my drill-through button on that screen. When adding a drill-through, remember to drag the value you which to drill on associated with the other table. In other words, I want to make sure I drag over the Parent Task column from the Project Plan, not the Project Checklist.
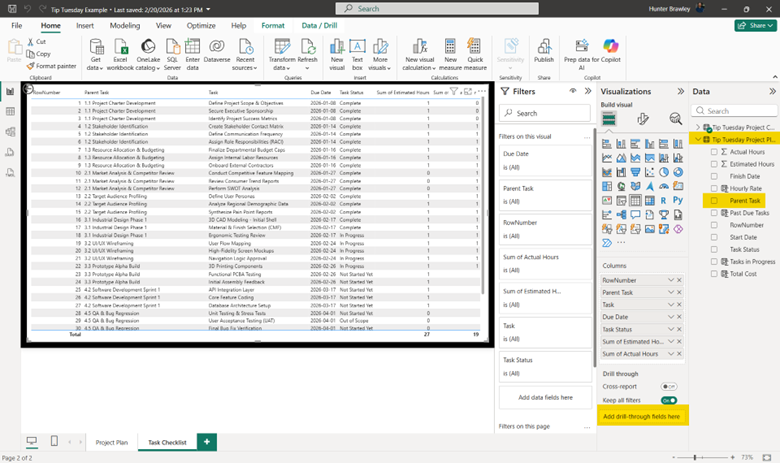
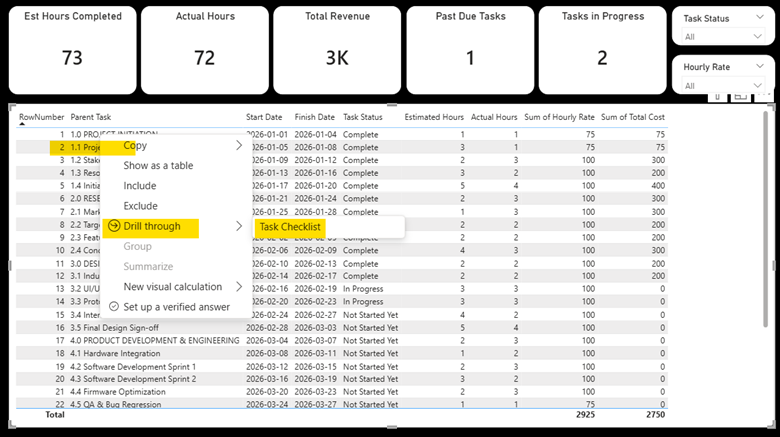
Now that our work is complete, we can test the process. Right click on the fourth row of the Project Plan table and select the “Task Checklist” button.
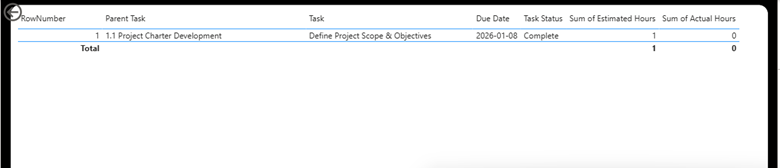
We can see below that the button took me to my Project Checklist page with the associated checklist task. Had there been more tasks with that Parent Task designator, those would have appeared below as well.
This process of assigning parent tasks to project plans and checklist can become a bit tedious, but the results can aid your team in task tracking measures to prevent missed deadlines and scope creep in your projects. If you have any questions regarding Smart Sheet and Power BI, or are interested in adding this solution to your company's report management repertoire, please visit our website - ConstrucTech Consulting - and Book a Call with one of our consultants.
In my last blog post, I outline how users could connect their Smart Sheet and Power BI environments to fully leverage the project management tools of the former and the data visualization tools of the latter. By combining the two solutions, those users can not only maintain effective project management practices but also provide themselves and others with reporting tools to provide a snapshot of a project’s overall health.
Today, we will outline how to not only provide data visualizations for a project plan and checklist, but strategies to connect both sheets in Power BI for seamless integration of hierarchical task tracking.
First, we will examine my two base sheets in Smart Sheet. I created a fake project, complete with tasks, due dates and parent tasks (these will be important when we connect the two sheets in Power BI). We can think of the Project Plan as the full scope of milestones we must complete to achieve our project’s goal while the Project Checklist is the detailed tasks necessary to complete those milestones.
I then connect the two sheets to my Power BI environment (see our blog post from 1/27/2026 for details). Once I have connected these two Smart Sheet pages to Power BI, I can construct my two dashboard pages.
Below you will find my Project Plan dashboard. I have a detailed matrix alongside several cards that provide context to my project and filters that allow me to slice through data.
You may notice that some data, like “Total Revenue” or “Past Due Tasks”, were not available to me in my Smart Sheet environment. By utilizing my Table View, I was able to create new columns from scratch like you see below. This feature allows for me to add key data that I may not need to track in Smart Sheet, like hourly rates or revenue.
My second sheet, the Project Checklist sheet below, is built similarly but only contains a detailed matrix, no cards or filters. That is because this page is a “Details” page and will act as my destination when I create a “Drill through” and connect the two pages.
Now that we have established our Project Plan and Project Checklist screens, we are ready to connect the two. I noted earlier that our Parent key would be important. My Project Checklist table has Project Plan task it is directly associated with already in a column. Since that key is there, I can build a relationship between the two similar columns and use it to drill through my data. To do that, I will open the Model view screen and select “Manage relationships” at the top of my screen.
Since my parent column tasks align exactly in the two separate pages, I can make this a many to many relationship without risking any breaks. Once, I have my relationship configured, I can hit “Save.”
With that work complete, I can finish my drill-through. Since my Project Checklist contains the broken-down lists of tasks associated with the Project Plan, I will add my drill-through button on that screen. When adding a drill-through, remember to drag the value you which to drill on associated with the other table. In other words, I want to make sure I drag over the Parent Task column from the Project Plan, not the Project Checklist.
Now that our work is complete, we can test the process. Right click on the fourth row of the Project Plan table and select the “Task Checklist” button.
We can see below that the button took me to my Project Checklist page with the associated checklist task. Had there been more tasks with that Parent Task designator, those would have appeared below as well.
This process of assigning parent tasks to project plans and checklist can become a bit tedious, but the results can aid your team in task tracking measures to prevent missed deadlines and scope creep in your projects. If you have any questions regarding Smart Sheet and Power BI, or are interested in adding this solution to your company's report management repertoire, please visit our website - ConstrucTech Consulting - and Book a Call with one of our consultants.


Get Started
Take your construction company to the next level. Schedule your initial free consultation and analysis.