Employing AI Chatbots to Assist in Power BI Reporting
This week, we cover how to utilize AI chatbots to improve your Power BI report.


Accurate data visualization tools are necessary for any business seeking to quickly identify patterns, trends and complex figures that would otherwise be missed in a large dataset. The current industry leader in this field is Microsoft’s Power BI, and Viewpoint Vista users can integrate their own software with this premiere instrument. With the power of data visualization and a simple integration, users can quickly and easily create reports and dashboards to analyze their Vista data.
We have access to Power BI through Trimble Construction One Analytics, but where do we start? How can we best streamline our report creation, especially if I am a new user? The answer may seem cliché, but an effective means for learning report creation is by utilizing Artificial Intelligence. By using a chatbot like a Chat GPT or M365 Copilot, I can build reports using a three-step process: build, consult, refine.
First, I want to attempt a dashboard on my own so that I can provide the AI agent with an outline for my reporting objectives. For the purpose of this post, we will use our “dummy” company with test-related financial information– Company 100 – to build a comprehensive job cost report with an overview module. I have built a simple example bellowing containing our relevant background information on the job, additional costing data, and a filter for our company.
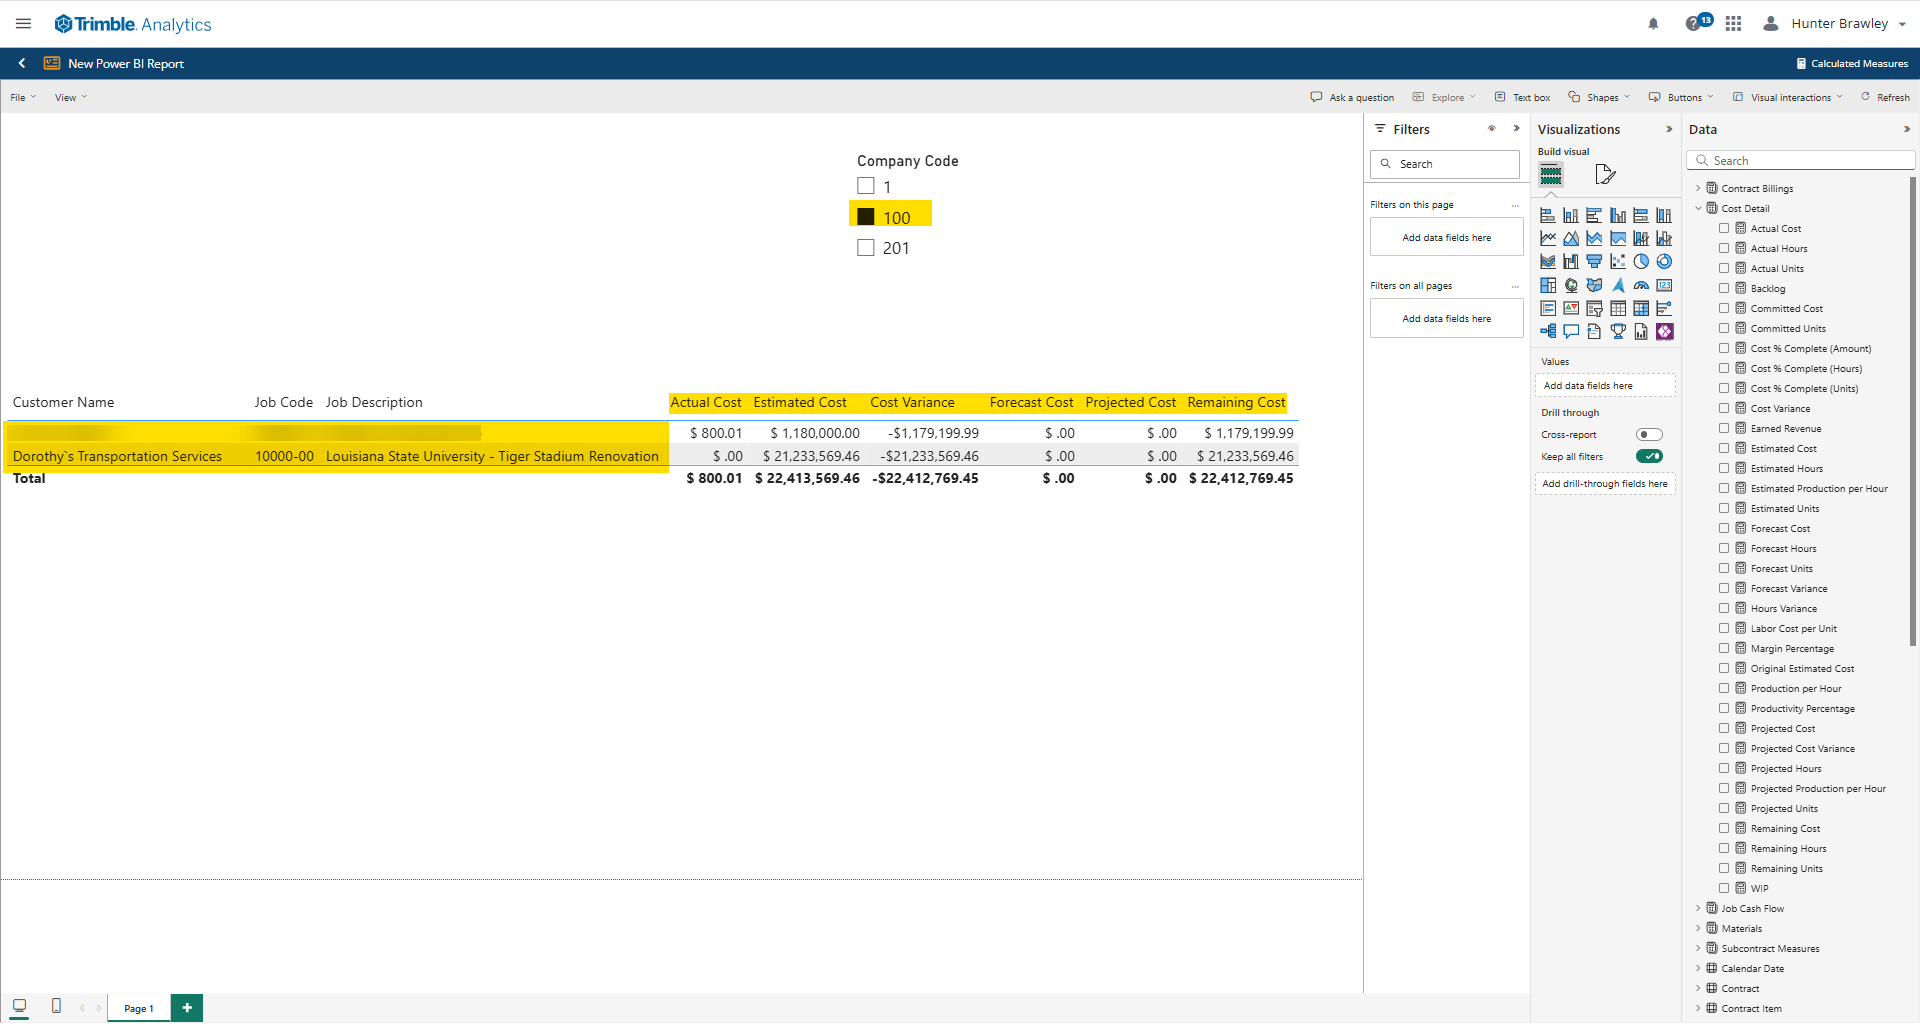
Just looking at my example, it provides relevant data to the viewer and will likely be enough to provide him/her with the proper costing knowledge they seek. That being said, if we use an AI chatbot, I bet we can spruce up our example and make it look more professional. To accomplish that goal, I sent a screenshot of the dashboard and the following prompt to M364 CoPilot:
“I created this simple dashboard for costing data related to my customers and their jobs. Can you help me improve the quality of the report by providing me with examples?”
The bot generated the following suggestions based on my prompt:

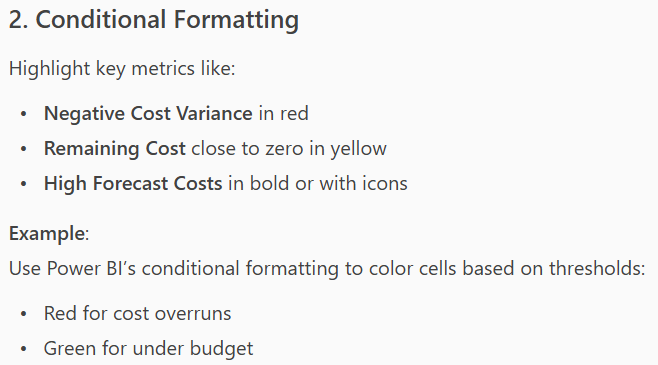
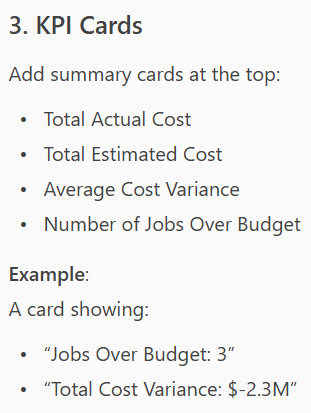
For those of us who are visual learners, I can also prompt the chatbot to generate an image for me to follow. The suggestions are not entirely perfect, but they clearly articulate possible avenues for report builders to explore.

Following these suggested improvements, I made a few adjustments to my own dashboard:
Though I still could make several adjustments to this dashboard and add others as well, the simply outline I received from my AI chatbot was enough to start me on the correct track. For anyone who is new to Power BI or wants to improve their already created dashboards, utilizing an AI chatbot can yield positive results and cut down on time spent troubleshooting. If you have any questions regarding Trimble Construction One’s dashboard capabilities or are interested in adding this software to your company's report management repertoire, please visit our website - ConstrucTech Consulting - and Book a Call with one of our consultants.
Accurate data visualization tools are necessary for any business seeking to quickly identify patterns, trends and complex figures that would otherwise be missed in a large dataset. The current industry leader in this field is Microsoft’s Power BI, and Viewpoint Vista users can integrate their own software with this premiere instrument. With the power of data visualization and a simple integration, users can quickly and easily create reports and dashboards to analyze their Vista data.
We have access to Power BI through Trimble Construction One Analytics, but where do we start? How can we best streamline our report creation, especially if I am a new user? The answer may seem cliché, but an effective means for learning report creation is by utilizing Artificial Intelligence. By using a chatbot like a Chat GPT or M365 Copilot, I can build reports using a three-step process: build, consult, refine.
First, I want to attempt a dashboard on my own so that I can provide the AI agent with an outline for my reporting objectives. For the purpose of this post, we will use our “dummy” company with test-related financial information– Company 100 – to build a comprehensive job cost report with an overview module. I have built a simple example bellowing containing our relevant background information on the job, additional costing data, and a filter for our company.
Just looking at my example, it provides relevant data to the viewer and will likely be enough to provide him/her with the proper costing knowledge they seek. That being said, if we use an AI chatbot, I bet we can spruce up our example and make it look more professional. To accomplish that goal, I sent a screenshot of the dashboard and the following prompt to M364 CoPilot:
“I created this simple dashboard for costing data related to my customers and their jobs. Can you help me improve the quality of the report by providing me with examples?”
The bot generated the following suggestions based on my prompt:
For those of us who are visual learners, I can also prompt the chatbot to generate an image for me to follow. The suggestions are not entirely perfect, but they clearly articulate possible avenues for report builders to explore.
Following these suggested improvements, I made a few adjustments to my own dashboard:
Though I still could make several adjustments to this dashboard and add others as well, the simply outline I received from my AI chatbot was enough to start me on the correct track. For anyone who is new to Power BI or wants to improve their already created dashboards, utilizing an AI chatbot can yield positive results and cut down on time spent troubleshooting. If you have any questions regarding Trimble Construction One’s dashboard capabilities or are interested in adding this software to your company's report management repertoire, please visit our website - ConstrucTech Consulting - and Book a Call with one of our consultants.


Get Started
Take your construction company to the next level. Schedule your initial free consultation and analysis.