Enhancing Project Analytics: Integrating Smartsheet with Power BI
Integrating Smartsheet with Power BI to transform project tracking into sophisticated, high-level business intelligence.

Effective data visualization is essential for leadership to track project progression, manage scope creep, and mitigate risks. While spreadsheets are a common starting point, they often struggle to scale with complex project demands.
To address this, many firms—including ours—utilize Smartsheet. Its Excel-like interface offers a familiar environment for teams to plan and automate workflows. However, while Smartsheet is a powerful management tool, its native "Dashboard" features can lack the granular reporting depth required for advanced business intelligence.
Many users are unaware that Smartsheet can connect directly to Microsoft Power BI. By integrating these platforms, you retain Smartsheet’s agility for daily task management while leveraging Power BI’s robust engine for high-level analytics. This pairing transforms your project data into a powerful, interactive reporting suite that drives more informed decision-making.
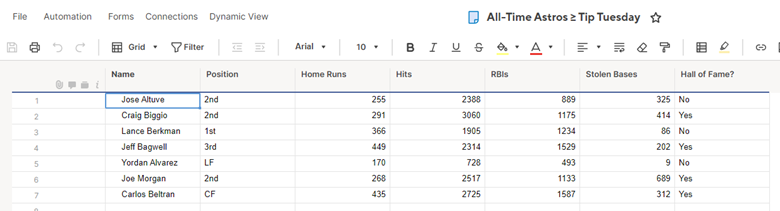
Below, I have an example of a data set in Smart Sheet. Typically, this sheet could be a project plan, risks/issues report, or support ticket tracker. In my sheet, I have a list of all-time great Houston Astro hitters. We are going to transfer this data from Smart Sheet to Power BI.
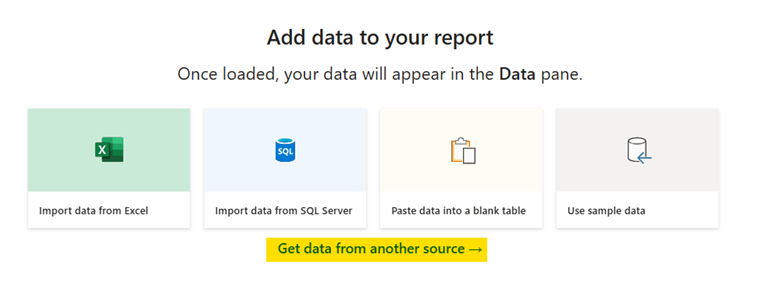
First, I am going to open a new report in the Power BI app on my desktop. As you see below, I have a few options for how I can extract data for my dashboard. To grab data from Smart Sheet, I select “Get data from another source.”
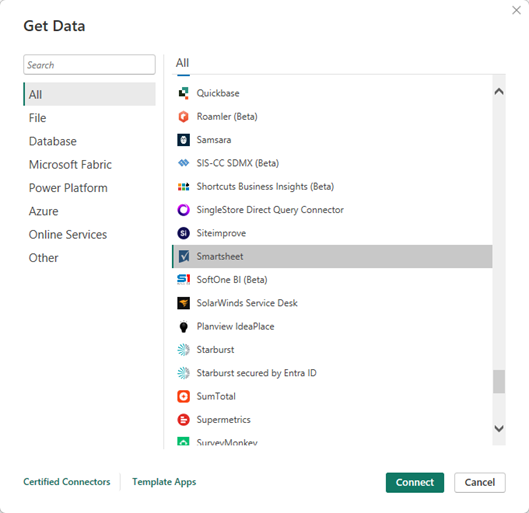
This button will open up a screen meant for us to select where we would like to grab our data. As you can see from my selection, Smartsheet is an already-listed option.
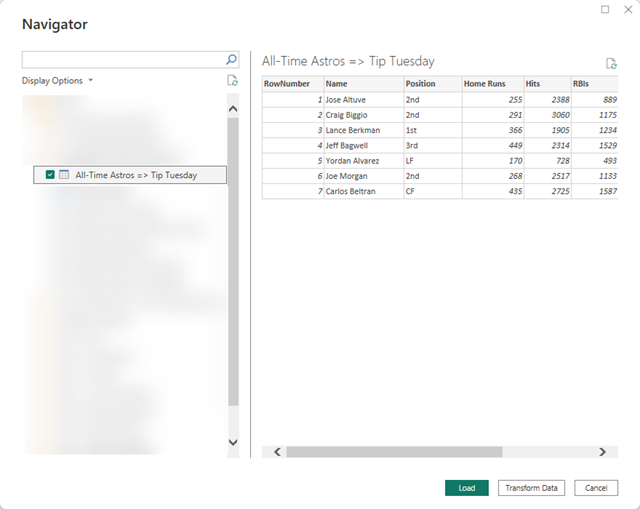
In my Navigator screen, I will select the example sheet from above.
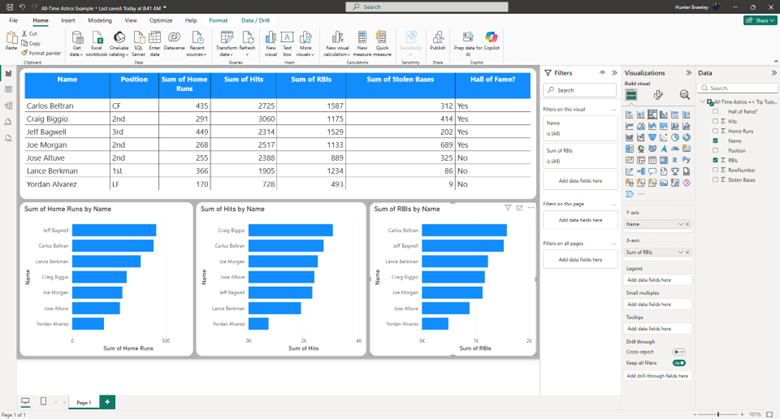
Below, I have built out an extremely simple Power BI dashboard totaling our figures and compare stats between these all-time great Astro hitters. In a later blog post, I will show you how to build Power BI reports around your Project Plan and other critical project management documents within Smartsheet.
All told, it is an extremely simple process to connect your Smartsheet environment to Power BI and can be highly beneficial to users at your firm. If you have any questions regarding Smartsheet and Power BI, or are interested in adding this solution to your company's report management repertoire, please visit our website - ConstrucTech Consulting - and Book a Call with one of our consultants.
Effective data visualization is essential for leadership to track project progression, manage scope creep, and mitigate risks. While spreadsheets are a common starting point, they often struggle to scale with complex project demands.
To address this, many firms—including ours—utilize Smartsheet. Its Excel-like interface offers a familiar environment for teams to plan and automate workflows. However, while Smartsheet is a powerful management tool, its native "Dashboard" features can lack the granular reporting depth required for advanced business intelligence.
Many users are unaware that Smartsheet can connect directly to Microsoft Power BI. By integrating these platforms, you retain Smartsheet’s agility for daily task management while leveraging Power BI’s robust engine for high-level analytics. This pairing transforms your project data into a powerful, interactive reporting suite that drives more informed decision-making.
Below, I have an example of a data set in Smart Sheet. Typically, this sheet could be a project plan, risks/issues report, or support ticket tracker. In my sheet, I have a list of all-time great Houston Astro hitters. We are going to transfer this data from Smart Sheet to Power BI.
First, I am going to open a new report in the Power BI app on my desktop. As you see below, I have a few options for how I can extract data for my dashboard. To grab data from Smart Sheet, I select “Get data from another source.”
This button will open up a screen meant for us to select where we would like to grab our data. As you can see from my selection, Smartsheet is an already-listed option.
In my Navigator screen, I will select the example sheet from above.
Below, I have built out an extremely simple Power BI dashboard totaling our figures and compare stats between these all-time great Astro hitters. In a later blog post, I will show you how to build Power BI reports around your Project Plan and other critical project management documents within Smartsheet.
All told, it is an extremely simple process to connect your Smartsheet environment to Power BI and can be highly beneficial to users at your firm. If you have any questions regarding Smartsheet and Power BI, or are interested in adding this solution to your company's report management repertoire, please visit our website - ConstrucTech Consulting - and Book a Call with one of our consultants.


Get Started
Take your construction company to the next level. Schedule your initial free consultation and analysis.